
Haftalık gelir
Haftalık indirme
Puan
Fiyat
Ekran görüntüleri


Sadece aboneler
Gelir tahminlerini, reklamları, şikâyetleri ve anahtar kelimeleri görmek için abone ol.
Lansman fırsatı: 31 Ekim 2026 tarihine kadar %50 indirim
Gelir geçmişi
Pro'da görünür
Aktif reklamlar
Pro'da görünür
Şikâyet konuları
Pro'da görünür
Açıklama
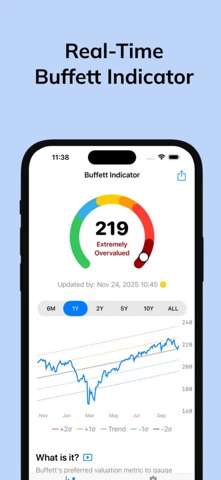
How expensive is the US stock market today? Buffett Indicator tracks the two valuation measures long-term investors watch most and shows where today's reading sits against decades of market history. KEY FEATURES • Buffett Indicator: the total value of the US stock market (Wilshire 5000) relative to US GDP, updated every day • Shiller PE (CAPE): the cyclically adjusted price-to-earnings ratio of the S&P 500, backed by 140+ years of history • Historical comparison: see how today's valuation stacks up against past decades • Valuation gauges: Color bands show at a glance how stretched the market is • Home Screen widget: today's readings without opening the app • Daily alert: a notification when the numbers update Built for long-term investors and macro watchers who want data, not headlines. Data comes from public sources: the Wilshire 5000, US GDP and S&P 500 earnings. For information and education only; not investment advice. Not affiliated with Warren Buffett or Berkshire Hathaway.
Anahtar kelimeler
Pro'da görünür