
Dashy - Dashboard Monitoring
Maximilian Kenfenheuer
Developer ToolsReleased Sep 11, 2026
Monthly revenue
Monthly downloads
Rating
Price
Maximilian Kenfenheuer
Monthly revenue
Monthly downloads
Rating
Price
Subscribe to see revenue estimates, ads, complaints and keywords.
Launch offer: 50% off until October 31, 2026

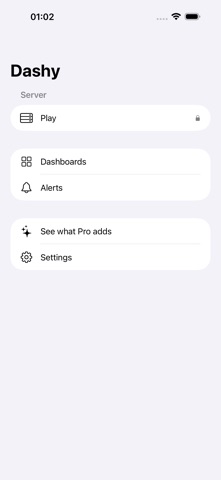

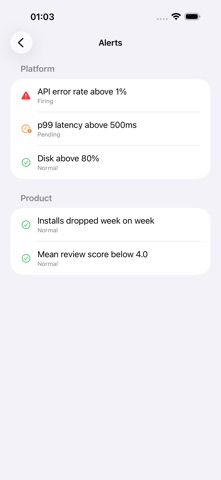

Dashy is a native client for Grafana®. Add a server, sign in, and every dashboard you can see on the web is on your phone, your tablet and your Mac — rendered by Grafana itself, so every panel type looks exactly as it should. BROWSING THAT FEELS NATIVE • Search every dashboard on the server, indexed server-side so it stays fast on a big install. • Starred dashboards first, everything else grouped by folder. • A native time-range picker, so changing the window is one tap and not a pinch and a squint. • Light and dark, following the app — and the dashboard follows with it. • Alert rules with their current state: firing, pending, or quiet. FREE One server. Browse, search and view every dashboard on it, and read your alert rules. No account with us, no trial, no advertising. PRO • Connect every server — keep production, staging and home on one screen. • Edit: star, rename, move and delete dashboards, and open Grafana's own editor. • Silence and pause alert rules from your phone. Pro is available as a monthly or yearly subscription, or as a one-time lifetime purchase. WHEREVER YOUR GRAFANA RUNS A rack at work or a Raspberry Pi in a cupboard; behind a reverse proxy, on a private CA, or on your LAN. Whatever your panels query — Prometheus, Loki, InfluxDB, SQL, Zabbix — Grafana renders them and Dashy shows them, so monitoring, observability and on-call duty all fit in a pocket. WHAT YOU NEED Your own Grafana server, reachable over HTTPS, and an account on it. Dashy connects directly to your server and to nobody else: your credentials are held in the keychain on your device and are never sent anywhere but the server you typed in. Grafana is a trademark of Grafana Labs. Dashy is not affiliated with, endorsed or sponsored by Grafana Labs or its affiliates.
Not on the US charts right now.